1. Introduction to Debugging HANA Procedures in Eclipse
As we are moving towards developing applications more and more on the native HANA stack or use hybrid scenarios to combine both the worlds(BW&HANA), it is important to understand how to debug procedures using the eclipse “Debug” perspective.
There are different development scenarios in which we use procedures(.hdbprocedure) or the system generates a procedure for. e.g. the use of HANA expert script based transformation creates a procedure inside the generated AMDP class. This blog series details on how to debug various procedures.
1. HANA Stored Procedures (.hdbprocedure)
2. HANA expert script based transformation
The script based calculation views can also be de-bugged by using the wrapper procedure that is created in the schema “_SYS_BIC” by the system. The method to de-bug these objects remains the same as de-bugging any native procedure, which will be explained in the later sections of this blog. Additionally there are a lot of scenarios in which the system generates wrapper procedures for e.g. Decision Table.
This is the part 1 one of the series, which explains about de-bugging the native stored procedures and in the part 2, i will discuss about de-bugging the HANA expert script based transformation( BW 7.4)
1.1 Pre-requisites
◉ Some versions of HANA would require a XS project to be created for the de-bugging to work.
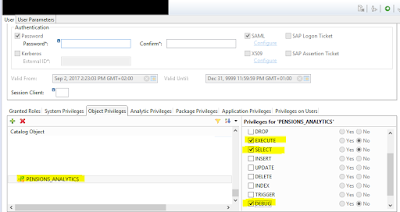
◉ The mandatory privileges required for the user (debug user) on the schema where the procedures are stored are:
1. SELECT
2. EXECUTE
3. DEBUG
The “Debug” perspective should be switched on.
1.1.2 Creating the XS Project
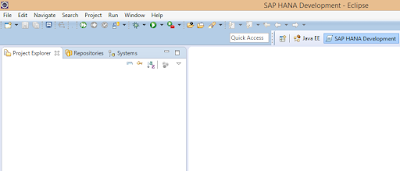
Step1: Switch to the HANA Development Perspective and go to the Project explorer view.
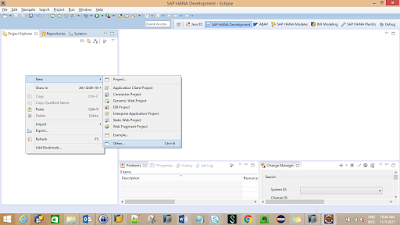
Step2: Go to the context menu and chose New=> Project => Other
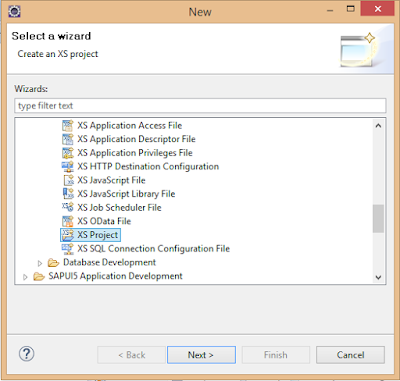
Step 3: In the Select Wizard, please chose XS project.
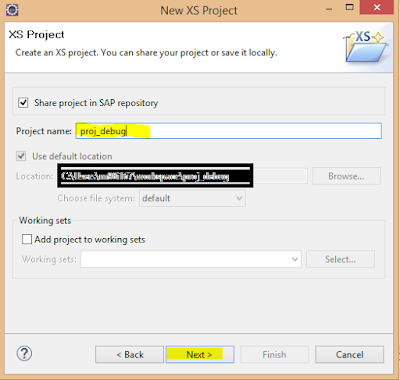
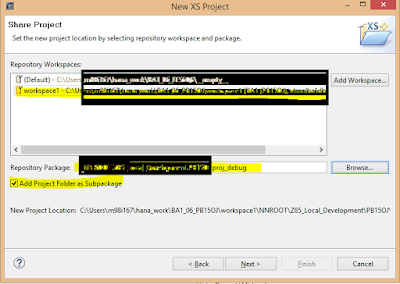
Step4: Fill in the relevant details , select the workspace and the repository package in which the native content has to be created.
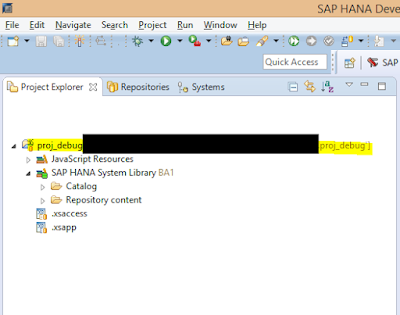
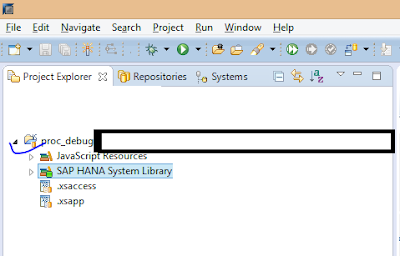
The XS Project is ready and is now visible in the project explorer view.
1.1.3 Privileges required to Debug
The below are the mandatory privileges required for the DEBUG user on the schema , where the procedures are stored.
For e.g. If the DEBUG user is ‘USER01’ and the Schema in which the procedures are present is ‘PENSIONS_ANALYTICS’.
1.1.4 Switching on the DEBUG Perspective
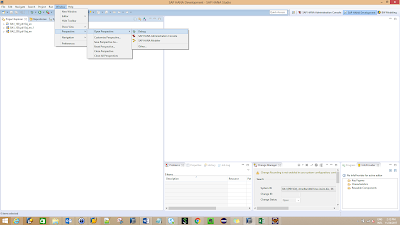
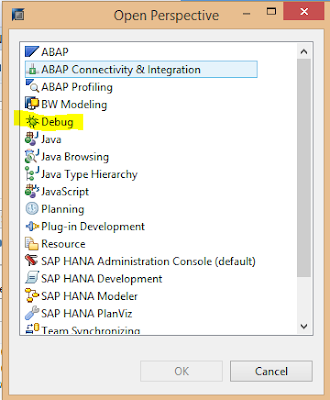
The Debug perspective can be switched on selecting the path as below in eclipse.
Window=>Perspective=>Open Perspective=>Debug
If it doesn’t show up , please select Other and select Debug in the dialog.
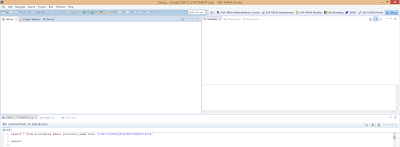
The Debug perspective opens up as below.
Now we are all set to start De-bugging the procedures.
2.Debugging a .hdbprocedure
For this scenario I will be using the procedure “TEST_DEBUG” present in the schema “USER01”.
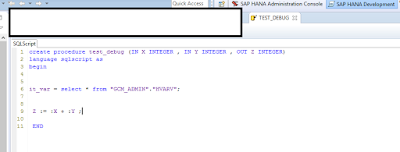
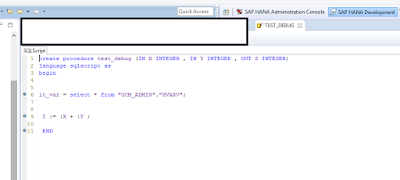
The definition of the procedure is as below.
The procedure contains two input parameters X , Y and an output parameter Z. The code block contains an intermediate variable “it_var” ( line 6), which contains the results of the SELECT statement from the table HVARV present in the schema GCM_ADMIN. ( I have used this to show on how to display results of the table during the debugging session)
Then we have an addition operation performed on X and Y and stored in Variable Z (line 9).
Step 1: Go to the XS project “proc_debug” from the Project explorer view.
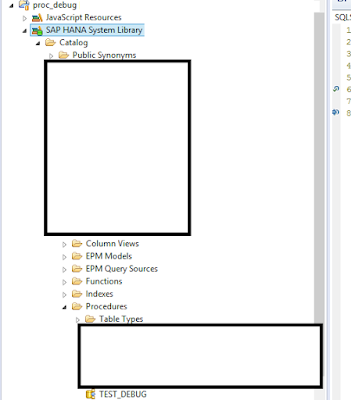
Step 2: Drop down the catalog from the SAP HANA System Library and point to the Schema and procedure.
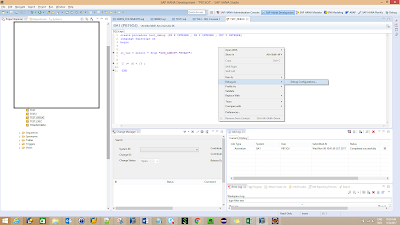
Step 3: Go to the context menu of the procedure, which you want to de-bug and choose “Open with SAP HANA Stored Procedure Viewer” and set the break-points at lines 6,9 and 11 by double-clicking.
Step 4: Now Right-Click and go to Debug=> Debug Configurations
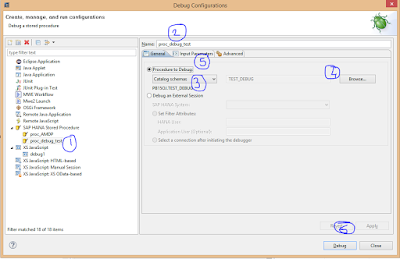
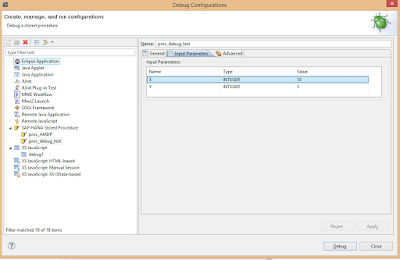
Step 5: The Debug configurations menu pops up , please create a new debug configuration “proc_debug_test” and from the General tab , select “Catalog Schemas” and browse for the procedure “TEST_DEBUG”.
Step 6: Click on the tab “Input Parameters” to see the input parameters based on the procedure definition are read-out. We can give values to these input parameters. In this example, I have given 10 for X and 5 for Y.
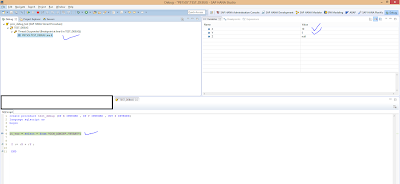
Step 7: Click on “Debug” and open the “Debug” perspective . The screen below shows up.
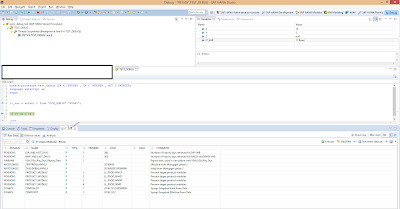
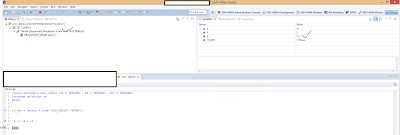
The Debugging thread is by default suspended at the first Break-point at line 6. In the pane on right, we can see the Variables filled with values. Now the output parameter of the procedure Z is also visible and the value is ‘Null’( as the control is at the first break point –line 6).
You can see the list of active break-points from the Breakpoints tab.
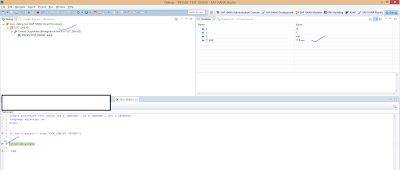
Step 8: For the control execution to go to the next break-point, please press F8. Now you can see the control is at line 9 and the intermediate variable “IT_VAR” is shown in the variable list and contains 11 rows.
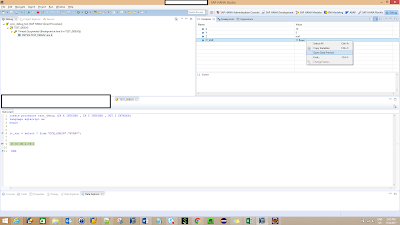
Step 9: To view the contents of the variable “IT_VAR” , please right click on the variable and select “Open Data Preview”.
Step 10: The content is displayed in the bottom pane in the Data Explorer view.
Step 11: Press F8 to go to the next break-point at line 11, which is also the end of the procedure. The debugging is suspended at line 11 as it is the end of the procedure and there are no more break-points and the variable Z is now filled with 15.
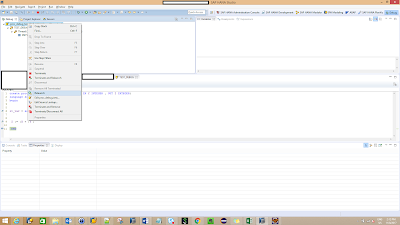
Step 9: If we want to re-start the debug session , please right-click on the Debug configuration and select “Relaunch”.

I appreciate your effort and you have done a great job.thanks for the ideas and please add more in future.
ReplyDeleteSoftware Testing Training in Chennai
testing courses in chennai
JAVA Training in Chennai
Python Training in Chennai
Big data training in chennai
SEO training in chennai
Software Testing Training in Chennai
Software testing training in T Nagar
Looking for best TNPSC study materials to prepare for the examination? Make use of our samacheer kalvi books and other study guide to learn from experts. TNPSC One Time Registration
ReplyDelete