Many a times users of SAP face performance issue on the system which in turn impact their daily tasks and business. One of the common cause behind such performance issues can be less efficient memory management analysis or improper load distribution which leads to high host/resource utilization. I am going to write series of blog on this issue and will share with you.
In today’s blog, will cover the data-flow creation and its analysis in BW for both. Lets’ start with creation of source system on HANA DB.
1) Go to Tcode RSA1 > Source Systems
2) In Source Systems > Right click – Create
3) Choose Connection Type “One logical system per DB Schema” and choose DB Owner/Schema as “SYS” or other as per requirement. Please note that you can consume you customer views created under your ID via this as well. Just choose your ID as DB Owner.
Query consumption in SAP Lumira or BO Dashboards is left to your imagination.
With the analysis on these views & queries, SAP HANA Architect/user can derive following potential benefits and many more:
◈ Find tables are unevenly distributed across servers and may require redistribution.
◈ Which table is occupying space in memory and can be unloaded if it is not used for reporting or any system related tasks (for example: DSO which are used for intermediate transformation of data can be unloaded to save space of memory)
◈ Find Tables which requires a data-cleanup check from Basis or BW end.
◈ Which server is highly utilized as compared to other servers and table/load distribution can be done accordingly.
◈ How much a server is utilized at most. (for example, if server is getting utilized at max at 30-35% at its peak time, then it infers that memory and processor can be saved from there which in turn will lead to cost saving for business)
In today’s blog, will cover the data-flow creation and its analysis in BW for both. Lets’ start with creation of source system on HANA DB.
How to use HANA Database as SOURCE SYSTEM in BW:-
1) Go to Tcode RSA1 > Source Systems
2) In Source Systems > Right click – Create
3) Choose Connection Type “One logical system per DB Schema” and choose DB Owner/Schema as “SYS” or other as per requirement. Please note that you can consume you customer views created under your ID via this as well. Just choose your ID as DB Owner.
4) Similarly, create other source system for _SYS_STAT (this is another SAP standard DB Schema).
Final Output will appear something like this:
Now, we need to create datasource of these source systems as per requirement. For example, we will be consuming below table via custom datasource.
Tables under SYS schema:
M_CS_TABLES
M_TABLE_PERSISTENCE_STATISTICS
TABLE_GROUPS
Tables under _SYS_STATISTICS schema:
HOST_RESOURCE_UTILIZATION_STATISTICS
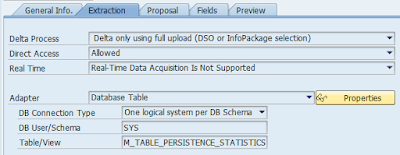
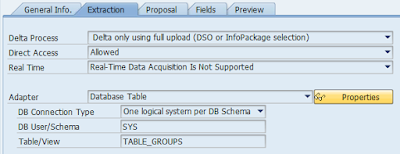
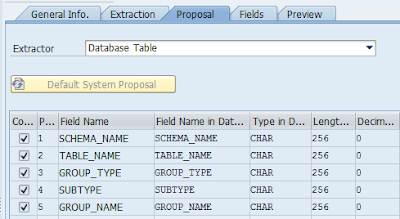
Create datasource for each of the schema with their respective properties shown in screenshot:
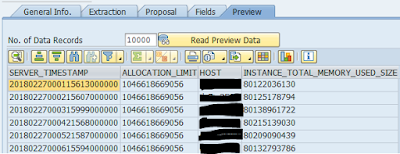
Datasource 1(DS_1) : Host Resource Utilization Statistics
The sample data fetched from this datasource will be something like below:
Here Fields selected have following meaning:
◈ SERVER_TIMESTAMP – Timestamp (local server time) identifying when a data collection actually occurred on the server
◈ ALLOCATION_LIMIT – Allocation limit for all processes
◈ HOST – Host name/Server Name
◈ INSTANCE_TOTAL_MEMORY_USED_SIZE – Amount of memory from the memory pool that is currently in actual use by SAP HANA processes
There are other fields as well in this schema which can be made visible under proposal tab by selecting them. For example: FREE_PHYSICAL_MEMORY, USED_PHYSICAL_MEMORY, TOTAL_CPU_SYSTEM_TIME_DELTA etc.
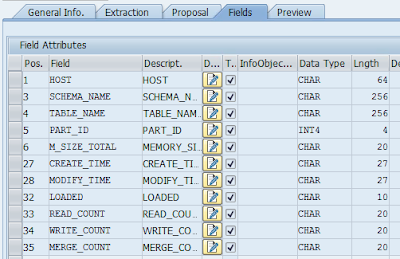
Datasource 2 (DS_2): M_CS_TABLES – Provides runtime data for column tables.
(there is M_RS_TABLES as well for Information on row tables: detailed table sizes and record count)
Meanings of few fields:
PART_ID: Partition ID. 0 for non-partitioned tables, 1 through number of partitions for partitioned tables. -1 if the whole table is unloaded.
MEMORY_SIZE_IN_TOTAL : Total memory size is the sum of memory size in main, delta, and history parts.
LOADED : Flag to show how many columns of table are loaded in memory (NO, PARTIALLY, and FULL); see M_CS_COLUMNS for each column
READ_COUNT: Number of read accesses on the table or partition. Note: This is not the number of SELECT statements against this table. A SELECT may involve
several read accesses.
WRITE_COUNT: Number of write accesses on the table or partition. Note: This is not the number of DML & DDL statements against this table. A DML or DDL statement may involve several write accesses.
MERGE_COUNT: Number of delta merges done on the table or partition
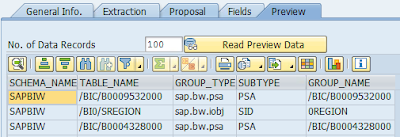
Data preview:
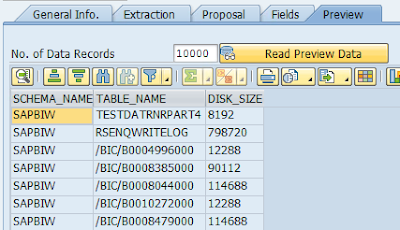
Datasource 3 (DS_3) : M_TABLE_PERSISTENCE_STATISTICS
Here DISK_SIZE – Total disk size of all table parts
Datasource 4 (DS_4): TABLE_GROUPS
Data here is self-explanatory.
For more details on used view and other views of interest, please refer to SAP Document “SAP HANA SQL and System Views Reference”
For saving memory on PSA, you may use below properties of DTP to extract data from these DB views: Extraction will be directly from Source system – here HANA DB Schema.
After creation of these data-sources, we can consume them in popular ADSO and Composite Provider – SAP Objects and create SAP query on it for analytics on data volume/memory management and host utilization.
Sample Dataflow has been explained below for lookups:
Composite Provider Scenario:-
Above ADSOs have been made part of JOIN/UNION in such a way in composite provider to full fill lookup criteria (explained transformation logic for same). We can make ROW STORED tables also part of this multiprovider.
Data flow:
◈ To Store memory related key figures more efficiently, convert them to GB or TB while storing them in ADSO.
For e.g. Disk Size (in GB) = DISK_SIZE / (1024^3)
◈ Table Type Info – Transformation Logic as it will be used as master data for determining table type:
◈ START ROUTINE
TYPES:
BEGIN OF TY_TABLE_NAME,
SCHEMA_NAME TYPE C LENGTH 256,
TABLE_NAME TYPE C LENGTH 256,
END OF TY_TABLE_NAME.
DATA: L_TABLE_NAME TYPE STANDARD TABLE OF TY_TABLE_NAME.
FIELD-SYMBOLS:
<L_TABLE_NAME> TYPE TY_TABLE_NAME.
SELECT TABNAME FROM DD02L
INTO TABLE L_TABLE_NAME
WHERE AS4LOCAL EQ 'A' AND TABCLASS IN ('TRANSP','POOL','CLUSTER').
LOOP AT L_TABLE_NAME ASSIGNING <L_TABLE_NAME>.
<L_TABLE_NAME>-TABLE_NAME = <L_TABLE_NAME>-SCHEMA_NAME.
<L_TABLE_NAME>-SCHEMA_NAME = 'SAPBIW'.
ENDLOOP.
LOOP AT SOURCE_PACKAGE ASSIGNING <SOURCE_FIELDS>.
DELETE L_TABLE_NAME WHERE TABLE_NAME EQ <SOURCE_FIELDS>-TABLE_NAME.
ENDLOOP.
APPEND LINES OF L_TABLE_NAME TO SOURCE_PACKAGE.
CLEAR: L_TABLE_NAME.
◈ END ROUTINE
DATA: L_TDESC TYPE STRING.
LOOP AT RESULT_PACKAGE ASSIGNING <RESULT_FIELDS>.
SELECT DDTEXT FROM DD02T INTO L_TDESC
WHERE TABNAME = <RESULT_FIELDS>-/B37/S_G_TABNAME.
ENDSELECT.
IF L_TDESC CO '0123456789'.
* skip translate.
IF <RESULT_FIELDS>-/B37/S_G_GNAME IS INITIAL.
CONCATENATE 'Info' L_TDESC INTO L_TDESC SEPARATED BY SPACE.
ELSE.
CONCATENATE <RESULT_FIELDS>-/B37/S_G_GNAME L_TDESC INTO L_TDESC
SEPARATED BY SPACE.
ENDIF.
ENDIF.
<RESULT_FIELDS>-/B37/S_G_TDESC = L_TDESC.
TRANSLATE <RESULT_FIELDS>-/B37/S_G_TDESC TO UPPER CASE.
* ENDIF.
CLEAR: L_TDESC.
IF ( <RESULT_FIELDS>-/B37/S_G_STYPE = 'ACTIVE' OR
<RESULT_FIELDS>-/B37/S_G_STYPE =
'QUEUE' ).
<RESULT_FIELDS>-/B37/S_G_STYPE = 'DSO'.
ELSEIF ( <RESULT_FIELDS>-/B37/S_G_STYPE = 'FACT_IMO' OR
<RESULT_FIELDS>-/B37/S_G_STYPE =
'FACT_F' OR <RESULT_FIELDS>-/B37/S_G_STYPE = 'FACT_E'
OR <RESULT_FIELDS>-/B37/S_G_STYPE = 'DIM' ).
<RESULT_FIELDS>-/B37/S_G_STYPE = 'CUBE'.
ELSEIF ( <RESULT_FIELDS>-/B37/S_G_STYPE = 'Y' OR
<RESULT_FIELDS>-/B37/S_G_STYPE = 'T' OR
<RESULT_FIELDS>-/B37/S_G_STYPE = 'Q' OR <RESULT_FIELDS>-/B37/S_G_STYPE
= 'P'
OR <RESULT_FIELDS>-/B37/S_G_STYPE = 'X' OR
<RESULT_FIELDS>-/B37/S_G_STYPE = 'H' OR
<RESULT_FIELDS>-/B37/S_G_STYPE = 'J' OR
<RESULT_FIELDS>-/B37/S_G_STYPE = 'I'
OR <RESULT_FIELDS>-/B37/S_G_STYPE = 'K' OR
<RESULT_FIELDS>-/B37/S_G_STYPE = 'SID' ).
<RESULT_FIELDS>-/B37/S_G_STYPE = 'MASTER_DATA'.
ELSE.
<RESULT_FIELDS>-/B37/S_G_STYPE = <RESULT_FIELDS>-/B37/S_G_STYPE.
ENDIF.
ENDLOOP.
Note:
1) Host Resource Utilization has been consumed in ADSO and then directly to Query.
2) IMPORTANT: For transports, please make sure that you maintain mapping logical systems for transport for new source systems created. One of the thing I struggled for days was that it was not maintained in target system in below table even though it was existing in RSA1>Source System.
It can be maintained via following two options:
Use view maintenance V_RSLOGSYSMAP in transaction sm30.
Call transaction RSA1 –> Transport connection –> select button CONVERSION
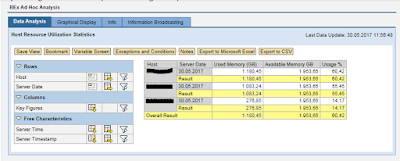
Query 1 Based on Host Resource Utilization Stats Flow:
Query showing maximum memory utilization on given day
Query 2: Based on datasource DS_2, DS_3, DS_4 and its flow:
With the analysis on these views & queries, SAP HANA Architect/user can derive following potential benefits and many more:
◈ Find tables are unevenly distributed across servers and may require redistribution.
◈ Which table is occupying space in memory and can be unloaded if it is not used for reporting or any system related tasks (for example: DSO which are used for intermediate transformation of data can be unloaded to save space of memory)
◈ Find Tables which requires a data-cleanup check from Basis or BW end.
◈ Which server is highly utilized as compared to other servers and table/load distribution can be done accordingly.
◈ How much a server is utilized at most. (for example, if server is getting utilized at max at 30-35% at its peak time, then it infers that memory and processor can be saved from there which in turn will lead to cost saving for business)









No comments:
Post a Comment