Introduction
There are different kinds of performance issue(high CPU/memory usage, lock wait for example) and even combination of them in SAP HANA DB due to the different use case, and it’s not easy to analyze them.
SAP HANA cockpit provides various apps to monitor/analyze performance issues. This article introduce an example to monitor and analyze the performance issue caused by heavy query execution.
Monitoring the Database
Performance Monitor, Monitor Statements could be used to check the SAP HANA DB overall resource usage and statement level information.
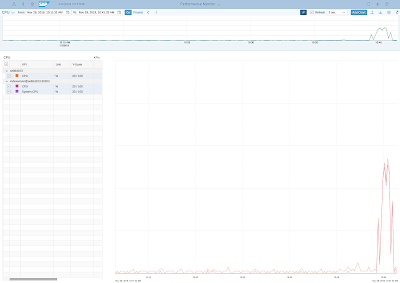
Once heavy query starts to run on the SAP HANA DB, we could detect sudden resource usage increase from Performance Monitor. Monitoring KPIs could also be customized in Performance Monitor. In this example, we check the CPU usage KPI.
Once detect the high CPU usage in the Performance Monitor app, Active Statements tab in Monitor Statements app could be used to check the running queries and their information, for example, statement runtime, allocated memory size and statement string. Query could also be canceled by selecting the line and click Cancel Session.
Analyze the performance issue
To analyze the performance issue, Workload Analysis app could be used. SAP HANA workload analyzer offers deeper insights into current system workload by analyzing thread samples. These samples are taken continuously with 10 seconds interval and offer a real-time look at what is going on in the customer’s system.
We could select the mapping time period observed during the monitoring step and set the time frame in the resource usage graph
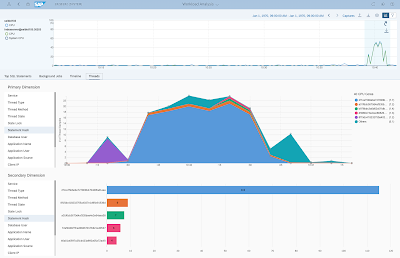
Threads tab in the Workload Analysis app offers two graph views showing the statistics for the selected dimension. To find out the heavy query, we could set both dimension as Statement Hash. Primary dimension shows the Top 5 most threads used query by sum the thread samples number per 10 seconds in the selected time period. Secondary dimension shows the Top 5 most thread usage query total thread samples count in the selected time period. It’s obvious that the top 1 query used most of the thread resource comparing with other queries.
We could click the statement hash in the first dimension graph to filter the thread samples of the top 1 query. The graph shows the query related thread number by each 10 seconds.
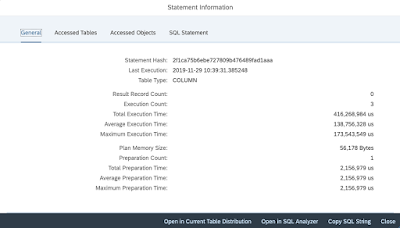
Then we could click the secondary dimension Top 1 query graph to see statement information.
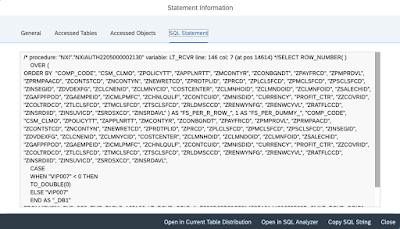
General information, statement accessed tables, statement accessed objects and statement string are available.
Procedure “NXI”.”NXIAUTH2205000002130″ execution, especially line 146, col:7 execution requested lots of threads and high CPU resource was used.


No comments:
Post a Comment