Content:
1. Starting with indexes (part I)
2. Limitations (part I)
3. SAP recommendations (part I)
4. Evaluate expensive statements (part I)
5. Analyzing the system
6. Performance comparison
7. Tools
If you don’t have any performance issues and no complaints from business users stop optimizing a system which don’t needs it. Every index has also side effects which should be evaluated carefully.
For the start check the current primary key and existing indexes of your table.
This can be done via scripts from the SQL collection (note 1969700).
If you only have the table name use the following statement:
HANA_Tables_ColumnStore_Columns
( SELECT /* Modification section */
'%' HOST,
'%' PORT,
'%' SERVICE_NAME,
'%' SCHEMA_NAME,
'<insert_table_name>' TABLE_NAME,
'%' DATA_TYPE,
40 COLUMN_NAME_LENGTH_LIMIT,
'% ATTRIBUTE_TYPE, /* CONCAT_ATTRIBUTE, TREX_EXTERNAL_KEY, TREX_UDIV, ROWID, TEXT, UNKNOWN, % */
'%' COMPRESSION_TYPE,
'%' LOADED,
'%' PAGEABLE,
' ' ONLY_INTERNAL_COLUMNS,
' ' EXCLUDE_PK_AND_UNIQUE,
' ' GENERATE_DROP_CONCAT_ATT_COMMAND,
'TABLE' OBJECT_LEVEL, /* TABLE, PARTITION */
'NONE' AGGREGATE_BY, /* HOST, PORT, SERVICE, SCHEMA, TABLE, COLUMN, DATA_TYPE, ATT_TYPE, PAGEABLE, LOADED, COMPRESSION or combinations, NONE for no aggregation */
'SIZE' ORDER_BY, /* SIZE, TABLE */
Please check the compression type (see part I – sparse / prefixed) for the possible affected index columns.
If you already have the statement hash use (which also includes the CS columns):
HANA_SQL_StatementHash_DataCollector* (depending on your revision)
( SELECT /* Modification section */
'1000/10/18 07:58:00' BEGIN_TIME, /* YYYY/MM/DD HH24:MI:SS timestamp, C, C-S<seconds>, C-M<minutes>, C-H<hours>, C-D<days>, C-W<weeks>, E-S<seconds>, E-M<minutes>, E-H<hours>, E-D<days>, E-W<weeks>, MIN */
'9999/10/18 08:05:00' END_TIME, /* YYYY/MM/DD HH24:MI:SS timestamp, C, C-S<seconds>, C-M<minutes>, C-H<hours>, C-D<days>, C-W<weeks>, B+S<seconds>, B+M<minutes>, B+H<hours>, B+D<days>, B+W<weeks>, MAX */
'<insert_hash>' STATEMENT_HASH,
-1 PLAN_ID,
20 MAX_RESULT_LINES,
86400 TRACE_HISTORY_S,
200 LINE_LENGTH,
' ' SHOW_COMPLETE_BIND_VALUE_LIST,
'H' TIME_UNIT /* MS, S, M, H, D */
In our example: Hash 426bdc1658f5f21d5bebf85ec4ab9c2c
******************
* THREAD SAMPLES *
******************
SAMPLES PERCENT HOST PORT THREAD_TYPE
======= ======= ======== ===== ==========
5033 54.07 hostname 30040 SqlExecutor
4275 45.92 hostname 30040 JobWorker
SAMPLES PERCENT THREAD_STATE LOCK_NAME
======= ======= ================
8209 88.19 Running ?
1093 11.74 Job Exec Waiting JobBarrier Wait for Jobs
3 0.03 Job Exec Waiting ?
2 0.02 Mutex Wait unnamed Mutex
1 0.01 Mutex Wait ?
SAMPLES PERCENT THREAD_TYPE THREAD_METHOD
======= ======= ===========
5033 54.07 SqlExecutor ExecutePrepared
4043 43.43 JobWorker RleScanVecOutJob<range>
230 2.47 JobWorker <unknown method>
2 0.02 JobWorker BarrierEmptyJob
SAMPLES PERCENT THREAD_TYPE THREAD_METHOD THREAD_DETAIL
======= ======= =========== ============
5033 54.07 SqlExecutor ExecutePrepared SELECT COUNT(*) FROM "VBEP" WHERE "MANDT" = ? AND "VBELN" = ? AND "EDATU" = ?
4043 43.43 JobWorker RleScanVecOutJob<range> ?
230 2.47 JobWorker <unknown method> <unknown job>
2 0.02 JobWorker BarrierEmptyJob ParallelDispatcher
ExecutePrepared stands just for the execution of an already prepared statement which is normal and no indicator for an intervention.
Completely different with RleScanVecOutJob<range>. This thread method is a definitely an indicator for a need of an index.
Another indicator can be check 890 and 1125 of the mini checks (HANA_Configuration_MiniChecks*):
|M0890|Unusual frequent thread methods (last hour) | |IndirectScanBvOutJob<BV> (5.33 threads) |none |X| 2114710|
|M1125|Columns with many scanned records | |MSEG.BUDAT_MKPF (41067249/s) |none |X| 2000002|
|M1125|Columns with many scanned records | |MSEG.MANDT (16265794/s) |none |X| 2000002|
|M1125|Columns with many scanned records | |MSEG.MATNR (375450570/s) |none |X| 2000002|
|M1125|Columns with many scanned records | |MSEG.MJAHR (354290653/s) |none |X| 2000002|
|M1125|Columns with many scanned records | |MSEG.WERKS (28137626/s) |none |X| 2000002|
Indication of necessity of an index
Thread methods like
◉ IndirectScanBvOutJob*
◉ JobParallelMgetSearch
◉ JobParallelPagedMgetSearch
◉ PrefixedScanVecOutJob
◉ PrefixedScanVecOutJob<range>
◉ RlePredScanJob<ScanVectorBinSearchPredicate>(out=vector)
◉ RlePredScanJob<ScanVectorPredicate>(out=vector)
◉ RleScanBvOutJob<BV>
◉ RleScanBvOutJob<range>
◉ RleScanVecOutJob<BV>
◉ RleScanVecOutJob<range>
◉ RleScanBvOutJob
◉ scanWithoutIndex
◉ ClusterIndexScanBvOutJob<ScanRangePredicate>
◉ ClusterScanBvOutJob<BV>
◉ ClusterScanBvOutJob<range>
◉ ClusterScanVecOutJob<range>
◉ SparseBvScanBvOutJob
◉ SparseBvScanVecOutJob
◉ SparsePredScanBvOutJob<ScanRangesPredicate>
◉ SparsePredScanVecOutJob<ScanRangesPredicate>
◉ SparsePredScanVecOutJob<ScanVectorBinSearchPredicate>
◉ SparsePredScanVecOutJob<ScanVectorPredicate>
◉ SparseRangeScanBvOutJob
◉ SparseRangeScanVecOutJob
◉ sparseSearch
◉ sse_icc_lib::mgetSearchi_AVX2impl
◉ sse_icc_lib::mgetSearchi_AVX
If you have found out the thread method, you have to go for the statement hash:
HANA_Threads_ThreadSamples_AggregationPerTimeSlice*
( SELECT /* Modification section */
'1000/10/18 07:58:00' BEGIN_TIME, /* YYYY/MM/DD HH24:MI:SS timestamp, C, C-S<seconds>, C-M<minutes>, C-H<hours>, C-D<days>, C-W<weeks>, E-S<seconds>, E-M<minutes>, E-H<hours>, E-D<days>, E-W<weeks>, MIN */
'9999/10/18 08:05:00' END_TIME, /* YYYY/MM/DD HH24:MI:SS timestamp, C, C-S<seconds>, C-M<minutes>, C-H<hours>, C-D<days>, C-W<weeks>, B+S<seconds>, B+M<minutes>, B+H<hours>, B+D<days>, B+W<weeks>, MAX */
'SERVER' TIMEZONE, /* SERVER, UTC */
'%' HOST,
'%' PORT,
-1 THREAD_ID,
'%' THREAD_TYPE, /* e.g. 'SqlExecutor', 'JobWorker' or 'MergedogMonitor' */
'%' THREAD_STATE, /* e.g. 'Running', 'Network Read' or 'Semaphore Wait' */
'RleScanVecOutJob%' THREAD_METHOD,
'%' THREAD_DETAIL,
'%' STATEMENT_HASH,
'%' ROOT_STATEMENT_HASH,
'%' STATEMENT_ID,
'%' STATEMENT_EXECUTION_ID,
'%' DB_USER,
'%' APP_NAME,
'%' APP_USER,
'%' APP_SOURCE,
'%' LOCK_TYPE,
'%' LOCK_NAME,
-1 NUMA_NODE,
'%' CLIENT_IP,
-1 CLIENT_PID,
-1 CONN_ID,
-1 MIN_SAMPLES_TOTAL,
60 TIME_SLICE_S,
'X' EXCLUDE_SERVICE_THREAD_SAMPLER,
'X' EXCLUDE_NEGATIVE_THREAD_IDS,
'X' EXCLUDE_PHANTOM_THREADS,
' ' EXCLUDE_EMPTY_STATEMENT_IDS,
' ' EXCLUDE_EMPTY_STATEMENT_EXECUTION_IDS,
'CURRENT' DATA_SOURCE,
'HASH' AGGREGATE_BY, /* SAMPLE_TIME, HOST, PORT, THREAD_ID, THREAD_TYPE, THREAD_METHOD, THREAD_DETAIL, THREAD_STATE, STATE_LOCK, HASH, ROOT, DB_USER, APP_NAME, APP_USER, APP_SOURCE, CLIENT_IP, CLIENT_PID, CONN_ID, LOCK_TYPE, LOCK_NAME, STATEMENT_ID, STAT_EXEC_ID, NUMA_NODE */
-1 RESULT_ROWS
=> in this example thread method RleScanVecOutJob (may be you have to adjust the data source to HISTORY)
1. Starting with indexes (part I)
2. Limitations (part I)
3. SAP recommendations (part I)
4. Evaluate expensive statements (part I)
5. Analyzing the system
6. Performance comparison
7. Tools
5. Analyzing the system
If you don’t have any performance issues and no complaints from business users stop optimizing a system which don’t needs it. Every index has also side effects which should be evaluated carefully.
For the start check the current primary key and existing indexes of your table.
This can be done via scripts from the SQL collection (note 1969700).
If you only have the table name use the following statement:
HANA_Tables_ColumnStore_Columns
( SELECT /* Modification section */
'%' HOST,
'%' PORT,
'%' SERVICE_NAME,
'%' SCHEMA_NAME,
'<insert_table_name>' TABLE_NAME,
'%' DATA_TYPE,
40 COLUMN_NAME_LENGTH_LIMIT,
'% ATTRIBUTE_TYPE, /* CONCAT_ATTRIBUTE, TREX_EXTERNAL_KEY, TREX_UDIV, ROWID, TEXT, UNKNOWN, % */
'%' COMPRESSION_TYPE,
'%' LOADED,
'%' PAGEABLE,
' ' ONLY_INTERNAL_COLUMNS,
' ' EXCLUDE_PK_AND_UNIQUE,
' ' GENERATE_DROP_CONCAT_ATT_COMMAND,
'TABLE' OBJECT_LEVEL, /* TABLE, PARTITION */
'NONE' AGGREGATE_BY, /* HOST, PORT, SERVICE, SCHEMA, TABLE, COLUMN, DATA_TYPE, ATT_TYPE, PAGEABLE, LOADED, COMPRESSION or combinations, NONE for no aggregation */
'SIZE' ORDER_BY, /* SIZE, TABLE */
Please check the compression type (see part I – sparse / prefixed) for the possible affected index columns.
If you already have the statement hash use (which also includes the CS columns):
HANA_SQL_StatementHash_DataCollector* (depending on your revision)
( SELECT /* Modification section */
'1000/10/18 07:58:00' BEGIN_TIME, /* YYYY/MM/DD HH24:MI:SS timestamp, C, C-S<seconds>, C-M<minutes>, C-H<hours>, C-D<days>, C-W<weeks>, E-S<seconds>, E-M<minutes>, E-H<hours>, E-D<days>, E-W<weeks>, MIN */
'9999/10/18 08:05:00' END_TIME, /* YYYY/MM/DD HH24:MI:SS timestamp, C, C-S<seconds>, C-M<minutes>, C-H<hours>, C-D<days>, C-W<weeks>, B+S<seconds>, B+M<minutes>, B+H<hours>, B+D<days>, B+W<weeks>, MAX */
'<insert_hash>' STATEMENT_HASH,
-1 PLAN_ID,
20 MAX_RESULT_LINES,
86400 TRACE_HISTORY_S,
200 LINE_LENGTH,
' ' SHOW_COMPLETE_BIND_VALUE_LIST,
'H' TIME_UNIT /* MS, S, M, H, D */
In our example: Hash 426bdc1658f5f21d5bebf85ec4ab9c2c
******************
* THREAD SAMPLES *
******************
SAMPLES PERCENT HOST PORT THREAD_TYPE
======= ======= ======== ===== ==========
5033 54.07 hostname 30040 SqlExecutor
4275 45.92 hostname 30040 JobWorker
SAMPLES PERCENT THREAD_STATE LOCK_NAME
======= ======= ================
8209 88.19 Running ?
1093 11.74 Job Exec Waiting JobBarrier Wait for Jobs
3 0.03 Job Exec Waiting ?
2 0.02 Mutex Wait unnamed Mutex
1 0.01 Mutex Wait ?
SAMPLES PERCENT THREAD_TYPE THREAD_METHOD
======= ======= ===========
5033 54.07 SqlExecutor ExecutePrepared
4043 43.43 JobWorker RleScanVecOutJob<range>
230 2.47 JobWorker <unknown method>
2 0.02 JobWorker BarrierEmptyJob
SAMPLES PERCENT THREAD_TYPE THREAD_METHOD THREAD_DETAIL
======= ======= =========== ============
5033 54.07 SqlExecutor ExecutePrepared SELECT COUNT(*) FROM "VBEP" WHERE "MANDT" = ? AND "VBELN" = ? AND "EDATU" = ?
4043 43.43 JobWorker RleScanVecOutJob<range> ?
230 2.47 JobWorker <unknown method> <unknown job>
2 0.02 JobWorker BarrierEmptyJob ParallelDispatcher
ExecutePrepared stands just for the execution of an already prepared statement which is normal and no indicator for an intervention.
Completely different with RleScanVecOutJob<range>. This thread method is a definitely an indicator for a need of an index.
Another indicator can be check 890 and 1125 of the mini checks (HANA_Configuration_MiniChecks*):
|M0890|Unusual frequent thread methods (last hour) | |IndirectScanBvOutJob<BV> (5.33 threads) |none |X| 2114710|
|M1125|Columns with many scanned records | |MSEG.BUDAT_MKPF (41067249/s) |none |X| 2000002|
|M1125|Columns with many scanned records | |MSEG.MANDT (16265794/s) |none |X| 2000002|
|M1125|Columns with many scanned records | |MSEG.MATNR (375450570/s) |none |X| 2000002|
|M1125|Columns with many scanned records | |MSEG.MJAHR (354290653/s) |none |X| 2000002|
|M1125|Columns with many scanned records | |MSEG.WERKS (28137626/s) |none |X| 2000002|
Indication of necessity of an index
Thread methods like
◉ IndirectScanBvOutJob*
◉ JobParallelMgetSearch
◉ JobParallelPagedMgetSearch
◉ PrefixedScanVecOutJob
◉ PrefixedScanVecOutJob<range>
◉ RlePredScanJob<ScanVectorBinSearchPredicate>(out=vector)
◉ RlePredScanJob<ScanVectorPredicate>(out=vector)
◉ RleScanBvOutJob<BV>
◉ RleScanBvOutJob<range>
◉ RleScanVecOutJob<BV>
◉ RleScanVecOutJob<range>
◉ RleScanBvOutJob
◉ scanWithoutIndex
◉ ClusterIndexScanBvOutJob<ScanRangePredicate>
◉ ClusterScanBvOutJob<BV>
◉ ClusterScanBvOutJob<range>
◉ ClusterScanVecOutJob<range>
◉ SparseBvScanBvOutJob
◉ SparseBvScanVecOutJob
◉ SparsePredScanBvOutJob<ScanRangesPredicate>
◉ SparsePredScanVecOutJob<ScanRangesPredicate>
◉ SparsePredScanVecOutJob<ScanVectorBinSearchPredicate>
◉ SparsePredScanVecOutJob<ScanVectorPredicate>
◉ SparseRangeScanBvOutJob
◉ SparseRangeScanVecOutJob
◉ sparseSearch
◉ sse_icc_lib::mgetSearchi_AVX2impl
◉ sse_icc_lib::mgetSearchi_AVX
If you have found out the thread method, you have to go for the statement hash:
HANA_Threads_ThreadSamples_AggregationPerTimeSlice*
( SELECT /* Modification section */
'1000/10/18 07:58:00' BEGIN_TIME, /* YYYY/MM/DD HH24:MI:SS timestamp, C, C-S<seconds>, C-M<minutes>, C-H<hours>, C-D<days>, C-W<weeks>, E-S<seconds>, E-M<minutes>, E-H<hours>, E-D<days>, E-W<weeks>, MIN */
'9999/10/18 08:05:00' END_TIME, /* YYYY/MM/DD HH24:MI:SS timestamp, C, C-S<seconds>, C-M<minutes>, C-H<hours>, C-D<days>, C-W<weeks>, B+S<seconds>, B+M<minutes>, B+H<hours>, B+D<days>, B+W<weeks>, MAX */
'SERVER' TIMEZONE, /* SERVER, UTC */
'%' HOST,
'%' PORT,
-1 THREAD_ID,
'%' THREAD_TYPE, /* e.g. 'SqlExecutor', 'JobWorker' or 'MergedogMonitor' */
'%' THREAD_STATE, /* e.g. 'Running', 'Network Read' or 'Semaphore Wait' */
'RleScanVecOutJob%' THREAD_METHOD,
'%' THREAD_DETAIL,
'%' STATEMENT_HASH,
'%' ROOT_STATEMENT_HASH,
'%' STATEMENT_ID,
'%' STATEMENT_EXECUTION_ID,
'%' DB_USER,
'%' APP_NAME,
'%' APP_USER,
'%' APP_SOURCE,
'%' LOCK_TYPE,
'%' LOCK_NAME,
-1 NUMA_NODE,
'%' CLIENT_IP,
-1 CLIENT_PID,
-1 CONN_ID,
-1 MIN_SAMPLES_TOTAL,
60 TIME_SLICE_S,
'X' EXCLUDE_SERVICE_THREAD_SAMPLER,
'X' EXCLUDE_NEGATIVE_THREAD_IDS,
'X' EXCLUDE_PHANTOM_THREADS,
' ' EXCLUDE_EMPTY_STATEMENT_IDS,
' ' EXCLUDE_EMPTY_STATEMENT_EXECUTION_IDS,
'CURRENT' DATA_SOURCE,
'HASH' AGGREGATE_BY, /* SAMPLE_TIME, HOST, PORT, THREAD_ID, THREAD_TYPE, THREAD_METHOD, THREAD_DETAIL, THREAD_STATE, STATE_LOCK, HASH, ROOT, DB_USER, APP_NAME, APP_USER, APP_SOURCE, CLIENT_IP, CLIENT_PID, CONN_ID, LOCK_TYPE, LOCK_NAME, STATEMENT_ID, STAT_EXEC_ID, NUMA_NODE */
-1 RESULT_ROWS
=> in this example thread method RleScanVecOutJob (may be you have to adjust the data source to HISTORY)
If you have found out the hash, you can translate it readable to SQL text via
HANA_SQL_StatementHash_SQLText:
( SELECT /* Modification section */
'426bdc1658f5f21d5bebf85ec4ab9c2c' STATEMENT_HASH,
60 LINE_LENGTH_TARGET,
' ' ADD_BLANK_AFTER_COMMA,
' ' REPLACE_BINDS,
'EXPENSIVE_STATEMENTS' BIND_VALUES
426bdc1658f5f21d5bebf85ec4ab9c2c
SELECT COUNT(*) FROM "VBEP" WHERE "MANDT" = ? AND "VBELN" =
? AND "EDATU" = ?
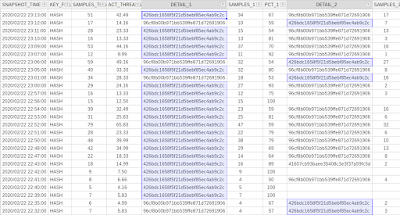
From the ColStats you can see which col is frequently scanned and has no index (=>INDEX_TYPE=NONE):
At first have a look at the where clause. The ideal index would be on MANDT, VBELN and EDATU. But you should choose as less columns as possible. For this you can calculate the selectivity as stated out in this blog. Alternatively, you test more variation with the performance comparison (see below).
In most of the systems with only one client you can create a single col index on EDATU (due selectivity). In our case we have more than 20 clients which makes it worth to add the client column MANDT to the index.
Result in a multi columns index on:
◉ MANDT
◉ EDATU
6. Performance comparison
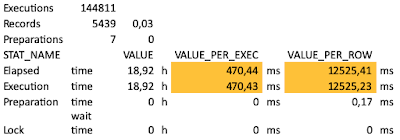
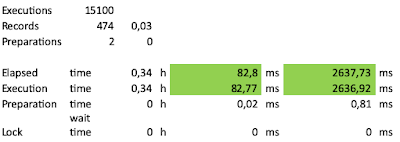
A before/after comparison is possible with the SQL: HANA_SQL_StatementHash_DiffReport
The difference of cursor and execution time is that the cursor time includes the client time.
6.1 Another example incl. thread method changes
Before
******************
* THREAD SAMPLES *
******************
SAMPLES PERCENT HOST PORT THREAD_TYPE
======= ======= ====================
2144 68.30 hostname 30040 JobWorker
995 31.69 hostname 30040 SqlExecutor
SAMPLES PERCENT THREAD_STATE LOCK_NAME
======= ======= ====================
2618 83.40 Running ?
518 16.50 Job Exec Waiting JobBarrier Wait for Jobs
3 0.09 Job Exec Waiting ?
SAMPLES PERCENT THREAD_TYPE THREAD_METHOD
======= ======= ===================
1988 63.33 JobWorker SparseIndexScanVecOutJob
995 31.69 SqlExecutor ExecQidItab
86 2.73 JobWorker IndirectIndexScanVecOutJob
65 2.07 JobWorker RleScanVecOutJob
5 0.15 JobWorker
SAMPLES PERCENT THREAD_TYPE THREAD_METHOD THREAD_DETAIL
======= ======= ===================
1988 63.33 JobWorker SparseIndexScanVecOutJob ?
995 31.69 SqlExecutor ExecQidItab ?
86 2.73 JobWorker IndirectIndexScanVecOutJob ?
65 2.07 JobWorker RleScanVecOutJob ?
5 0.15 JobWorker
63% SparseIndexScanVecOutJob
32% ExecQidItab
3% IndirectIndexScanVecOutJob
Nearly 2/3 of the time were spend on thread methods which are an indicator for a need of an index.
After
Executions 15100
Records 474 0,03
Preparations 2 0
STAT_NAME VALUE VALUE_PER_EXEC VALUE_PER_ROW
Elapsed time 0,34 h 82,8 ms 2637,73 ms
Execution time 0,34 h 82,77 ms 2636,92 ms
Preparation time 0 h 0,02 ms 0,81 ms
Lock wait time 0 h 0 ms 0 ms
******************
* THREAD SAMPLES *
******************
SAMPLES PERCENT HOST PORT THREAD_TYPE
======= ======= ==================
13 100.00 hostname 30040 SqlExecutor
SAMPLES PERCENT THREAD_STATE LOCK_NAME
======= ======= ==================
13 100.00 Running ?
SAMPLES PERCENT THREAD_TYPE THREAD_METHOD
======= ======= ==================
13 100.00 SqlExecutor ExecQidItab
SAMPLES PERCENT THREAD_TYPE THREAD_METHOD THREAD_DETAIL
======= ======= =================
13 100.00 SqlExecutor ExecQidItab ?
=> 100% ExecQidtab
=> but still room for improvement, but not for the execution plan => optimize compression
7. Tools
7.1 SHDB_INDEX_ANALYZE
The report SHDB_INDEX_ANALYZE from SAP note 1794297 should be executed as post conversion task.
“SHDB_INDEX_ANALYZE analyzes the data distribution of the largest tables in the system and suggests indexes on those fields which are highly selective and part of secondary indexes defined for traditional data bases. This report analyzes SAP and customer tables and indexes. This report has to run on the system already ported to HANA and should contain the full production data.”
7.2 SHDB_INDEX_CREATE
“SHDB_INDEX_CREATE creates secondary indexes based on a suggestion list imported into the select option INDFLD. The naming convention of this list per entry is
-Three characters to identify the SAP or customer namespace (SAP or. CUS)
-table name
-“~”
-field name
If available this report should run in the corresponding development system. The created indexes will then be transported through the landscape with standard mechanisms.”
7.3 SHDB_INDEX_CHECK
SHDB_INDEX_CHECK checks the created Indexes and ensures that all required indexes are created on the HANA data base. Additionally, the corresponding transport request entries are created.
7.4 indexAdvisor.py
Use the index adviser to find out for which tables and columns indexing would be most valuable. The indexAdvisor.py script is part of a SAP HANA system installation and runs from the command line. It is located in the $DIR_INSTANCE/exe/python_support directory.
7.5 SQL Collection
The best tool to analyze the performance and determine the col combinations for an index are statements in note 1969700. Get familiar with them and combine it with the know-how of the most popular FAQ HANA notes. There is no silver bullet as general recommendation.


No comments:
Post a Comment