Starting with version 2203 of the Automated Predictive Library (APL) intermittent time series are given a special treatment. When the target value has many zeros, typically when the demand for a product or a service is sporadic, APL will no longer put in competition various forecasting models, but it will systematically use the Single Exponential Smoothing (SES) technique.
For SAP Analytics Cloud users, this functionality is coming with the 2022.Q2 QRC release in May.
Let’s take the following monthly quantity as an example.
from hana_ml import dataframe as hd
conn = hd.ConnectionContext(userkey='MLMDA_KEY')
sql_cmd = 'SELECT * FROM "APL_SAMPLES"."MONTHLY_SALES" ORDER BY "Date"'
series_in = hd.DataFrame(conn, sql_cmd)
series_in.head(8).collect()
If we run a fit and predict with APL 2203 …
from hana_ml.algorithms.apl.time_series import AutoTimeSeries
apl_model = AutoTimeSeries(time_column_name= 'Date', target= 'Qty_Sold', horizon= 4,
variable_value_types ={'Date': 'continuous', 'Qty_Sold': 'continuous'})
series_out = apl_model.fit_predict(data = series_in)
df_out = series_out.collect()
dict = {'ACTUAL': 'Actual',
'PREDICTED': 'Forecast',
'LOWER_INT_95PCT': 'Lower Limit',
'UPPER_INT_95PCT': 'Upper Limit' }
df_out.rename(columns=dict, inplace=True)
and plot the predicted values …
import hvplot.pandas
df_out.hvplot.line(
'Date' , ['Actual','Forecast'],
value_label='Ozone Rate',
title = 'Monthly Quantity', grid =True,
fontsize={'title': 10, 'labels': 10},
legend = 'bottom', height = 350, width = 900
)
we get this :
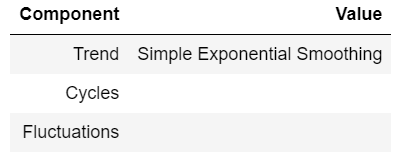
We display the model components to check if we see: “Simple Exponential Smoothing”.
import pandas as pd
d = apl_model.get_model_components()
components_df = pd.DataFrame(list(d.items()), columns=["Component", "Value"])
components_df.style.hide_index()
To evaluate the forecast accuracy, we display the MAE and RMSE indicators. The MAPE indicator has been discarded intentionally because of the zero values.
import numpy as np
d = apl_model.get_performance_metrics()
# Average each indicator across the horizon time window
apm = []
for k, v in d.items():
apm.append((k, round(np.mean(v),4)))
# Put the results in a dataframe
accuracy_df = pd.DataFrame(apm, columns=["Indicator", "Value"])
df = accuracy_df[accuracy_df.Indicator.isin(['MeanAbsoluteError','RootMeanSquareError'])].copy()
format_dict = {'Value':'{:,.3f}'}
df.style.format(format_dict).hide_index()
APL 2203 uses Single Exponential Smoothing not only for intermittent series. SES is a common technique to model time series that show no trend and no seasonality, like this quarterly series:
sql_cmd = 'SELECT * FROM "APL_SAMPLES"."SUPPLY_DEMAND" ORDER BY "Date"'
series_in = hd.DataFrame(conn, sql_cmd)
df_in = series_in.collect()
df_in.hvplot.line(
'Date' , ['Demand_per_capita'],
value_label='Demand per capita',
title = 'Supply Demand', grid =True,
fontsize={'title': 10, 'labels': 10},
legend = 'bottom', height = 350, width = 900
)
Here the SES model wins the competition against the other APL candidate models.
apl_model = AutoTimeSeries(time_column_name= 'Date', target= 'Demand_per_capita', horizon=4)
series_out = apl_model.fit_predict(data = series_in)
df_out = series_out.collect()
dict = {'ACTUAL': 'Actual',
'PREDICTED': 'Forecast',
'LOWER_INT_95PCT': 'Lower Limit',
'UPPER_INT_95PCT': 'Upper Limit' }
df_out.rename(columns=dict, inplace=True)
d = apl_model.get_model_components()
components_df = pd.DataFrame(list(d.items()), columns=["Component", "Value"])
components_df.style.hide_index()
The forecasted values happen to be, in this case, a Lag 1 (value at t+1 = value at t).
df_out.tail(8)
As you may have already noticed in the previous example, SES produces a flat forecast.
df_out.hvplot.line(
'Date' , ['Actual','Forecast'],
value_label='Demand per capita',
title = 'Supply Demand', grid =True,
fontsize={'title': 10, 'labels': 10},
legend = 'bottom', height = 350, width = 900
)
To check the forecast accuracy on this non-intermittent series, we can include the MAPE indicator.
d = apl_model.get_performance_metrics()
apm = []
for k, v in d.items():
apm.append((k, round(np.mean(v),4)))
# Put the results in a dataframe
accuracy_df = pd.DataFrame(apm, columns=["Indicator", "Value"])
df = accuracy_df[accuracy_df.Indicator.isin(['MAPE','MeanAbsoluteError','RootMeanSquareError'])].copy()
df['Indicator'] = df.Indicator.str.replace('MeanAbsoluteError','MAE').str.replace('RootMeanSquareError','RMSE')
format_dict = {'Value':'{:,.3f}'}
df.style.format(format_dict).hide_index()


No comments:
Post a Comment