The description runtime dump means not only when you trigger it manually or when a system crashes.
In this blog I will explain with 2 examples (OOM dump and indexserver crash) which tools you can use to analyze them and what you have to watch out for.
1. High level: creation of a runtime dump
i. manual trigger
ii. Other configurable triggers
2. Tools for an analysis (OOM example)
i. HANA Dump Viewer
ii. HANA Dump Analyzer
iii. Old school way
3. Indexserver Crash example
There are different kinds of runtime dumps:
Have a look at the following areas to get a quick overview:
In this blog I will explain with 2 examples (OOM dump and indexserver crash) which tools you can use to analyze them and what you have to watch out for.
1. High level: creation of a runtime dump
i. manual trigger
ii. Other configurable triggers
2. Tools for an analysis (OOM example)
i. HANA Dump Viewer
ii. HANA Dump Analyzer
iii. Old school way
3. Indexserver Crash example
High level: creation of a runtime dump
There are different kinds of runtime dumps:
| Classic | *.rtedump.<timestamp>.trc |
| Memory | *.rtedump.<timestamp>.oom.trc |
| Index handle waits | *.indexhandle_blocked.trc |
| Slave indexserver start / stop: | * longrunning_start_stop.trc |
| Long running transaction commit / rollback / cancellation | *.longrunning_transaction.trc |
| Page corruption | *.rtedump.<timestamp>.page.trc |
| Savepoint | *.savepoint_blocked.trc |
| Log shipping timeout | *.secondaryReplayTimeout.trc |
| Table replication turned off | *.table_replication_turn_off.trc |
They are all created inside the trace directory of the systemdb (alias cdtrace) or tenant (cdtrace; cd DB_<tenant_SID>).
I think the most famous are the first two once. Every time a service is crashing or running out-of-memory (oom) such a runtime dump is written for further analysis. But if the system is in a tricky situation and you are finding the root cause or a solution not point in time, you will save the status of the threads and the system views for further analysis or another expert. Therefor you can trigger a dump manually:
1. via command line: Python script
2. via command line: hdbcons
3. via SQL command
4. hana cockpit: Collect and Download Diagnosis Information
Manual trigger
1. Python script
#As sidadm:
cdpy
python fullSystemInfoDump.py
2. hdbcons
#For Indexserver
hdbcons [-p <pid>] “runtimedump dump”
#for Nameserver:
hdbcons [-p <pid>] -e 'hdbnameserver' “runtimedump dump”
3. SQL
With SPS4 and upwards:
ALTER SYSTEM CREATE RUNTIMEDUMP [AT '<host>:<port>'] [SECTIONS <sections> | PROFILE <profile>] [INTO FILE <file>]
Other configurable triggers
If you have trouble with long running savepoints:
indexserver.ini -> [persistence] -> runtimedump_for_blocked_savepoint_timeout = <x> (unit seconds)
If you want to display the values of the bind variables use:
indexserver.ini -> [sql] -> display_sql_statement_parameters_in_dump = true
Tools for an analysis (OOM example)
There are currently 2 official tools you can use:
◉ SAP HANA Dump Viewer
◉ SAP HANA Dump Analyzer
At first, we will throw some light on the difference of SAP HANA Dump Analyzer and SAP HANA Dump Viewer.
The HANA Dump Viewer is a python tool which is designed to be on the HANA server itself. Python is part of every HANA installation – nothing to install here besides the script.
The Dump Analyzer is a java tool which should be placed on your client. It is java so it is working on windows, MAC or Linux.
The HANA Dump Analyzer is the newer tool and has all features of the Viewer as GUI.
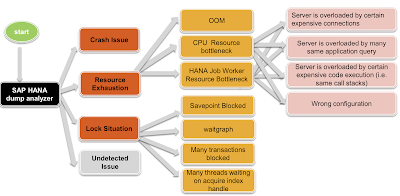
If you like the quick and dirty way and you may not have rights to run java then you should use the HANA Dump Viewer. In all other cases just use the Dump Analyzer because there are features like flame graphs, memory leak detection, auto analyzer etc. which will make your life easier if you are not familiar with runtime dumps.
SAP HANA Dump Viewer (python)
#change to the trace directory (systemDB / nameserver) as sidadm:
cdtrace
ls -lrt *rte*
sidadm@hostname:/usr/sap/SID/HDB00/vhostname/trace> ls -lrt *rte*
-rw-r--r-- 1 sidadm sapsys 1940488 Dec 20 02:40 nameserver_vhostname.30001.rtedump.20191220-024019.028599.oom.trc
-rw-r--r-- 1 sidadm sapsys 1931891 Dec 21 14:19 nameserver_vhostname.30001.rtedump.20191221-141934.028599.oom.trc
-rw-r--r-- 1 sidadm sapsys 1907141 Dec 22 14:26 nameserver_vhostname.30001.rtedump.20191222-142630.028599.oom.trc
#change the directory to the tenant
cd DB_*
ls -lrt *rte*
sidadm@hostname:/usr/sap/SID/HDB00/vhostname/trace/DB_TenaneSID> ls -lrt *rte*
-rw-r--r-- 1 sidadm sapsys 2431267 Dec 19 02:40 indexserver_vhostname.30040.rtedump.20191219-024019.065384.oom.trc
-rw-r--r-- 1 sidadm sapsys 2020932 Dec 20 02:40 indexserver_vhostname.30040.rtedump.20191220-024019.065384.oom.trc
-rw-r--r-- 1 sidadm sapsys 2134609 Dec 21 14:19 indexserver_vhostname.30040.rtedump.20191221-141934.065384.oom.trc
-rw-r--r-- 1 sidadm sapsys 2099624 Dec 22 14:26 indexserver_vhostname.30040.rtedump.20191222-142604.065384.oom.trc
-rw-r--r-- 1 sidadm sapsys 1883623 Dec 25 21:57 indexserver_vhostname.30040.rtedump.20191225-215711.065384.oom.trc
Usage:
1. Download the script from github and read the pdf
2. Create a file in a /tmp directory or for resident usage into the python path of the HANA DB (cdpy – check the correct rights for this)
3. Run the script: python <scriptname.py> <options>
Example as sidadm
cdtrace; cd DB_*
python /usr/sap/SID/HDB00/exe/python_support/hanadumpviewer.py -df indexserver_hostname.30040.rtedump.20191225-215711.065384.oom.trc
File /tmp/hanadumpviewer_output/indexserver_hostname.30040.rtedump.20191225-215711.065384.oom.trc.dot was created
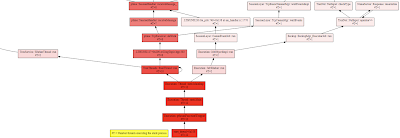
Such a *.dot file can be visualized with webgraphviz. Just paste the content of the *.dot file on the website.
In every dump there are also the extraction of the system views. You can copy them via editor and copy them to excel or you can do it the easy way with the HANADump viewer option “-mv”. This is valuable when the retention time of the systems views are over and the data were deleted.
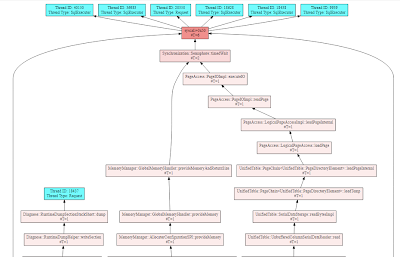
In this mode the graph separates the normal and the exception threads:
Normal threads are shown in cyan colored boxes and have a thread id + thread type.
python /usr/sap/SID/HDB00/exe/python_support/hanadumpviewer.py -df indexserver_hostname.30040.rtedump.20191225-215711.065384.oom.trc -pt true
File /tmp/hanadumpviewer_output/indexserver_hostname.30040.rtedump.20191225-215711.065384.oom.trc.dot was created
Exception threads are shown in orange colored boxes, their id is simply their order number in the .trc file and they have a reason for failure:
Normally there should be an exception thread and the identification is easy. But in our case there is no orange colored box:
So, one way is to go the old school (expert with experience) manual way:
Look into the dump via an editor
Table of contents of an oom dump:
[BUILD] Build information
[STACK_SHORT] Short call stacks and pending exceptions of all threads
[PROCESS_INFO] Process Info
[THREADS] Running threads
[OS_MEMORY] Operating system information about memory
[MEMORY_OOM] Information about current out of memory situation
hdbcons “runtimedump l” for an overview of all sections
Have a look into the following areas (search for the terms) to get a quick overview:
[OS_MEMORY]
[MEMORY_OOM]
For details about the meminfo and the linux memory management check out my latest blog.
[OS_MEMORY] Operating system information about memory: (2019-12-25 21:57:11 927 Local)
Maximum size of the process's virtual memory: soft limit=18446744073709551615, hard limit=18446744073709551615
/proc/meminfo:
MemTotal: 209519808 kB
MemFree: 44673280 kB
MemAvailable: 48709312 kB
Buffers: 19584 kB
Cached: 21846592 kB
SwapCached: 36992 kB
Active: 141622400 kB
Inactive: 17604096 kB
Active(anon): 137681920 kB
Inactive(anon): 16901312 kB
Active(file): 3940480 kB
Inactive(file): 702784 kB
Unevictable: 185216 kB
Mlocked: 185216 kB
SwapTotal: 12578688 kB
SwapFree: 11258048 kB
Dirty: 3904 kB
Writeback: 0 kB
AnonPages: 137531008 kB
Mapped: 17483392 kB
Shmem: 17191808 kB
Slab: 1387456 kB
SReclaimable: 698752 kB
SUnreclaim: 688704 kB
KernelStack: 26432 kB
PageTables: 1580224 kb
[MEMORY_OOM] Information about current out of memory situation: (2019-12-25 21:57:11 929 Local)
OUT OF MEMORY occurred.
Host: hostname
Executable: hdbindexserver
PID: 65384
Failed to allocate 3gb (3221225472b).
Allocation failure type: PROCESS_ALLOCATION_LIMIT
Current callstack:
1: 0x00007fff75ef1fcc in MemoryManager::PoolAllocator::notifyOOM(unsigned long, bool) const+0xdc at PoolAllocator.cpp:2911 (libhdbbasis.so)
2: 0x00007fff75fefd20 in MemoryManager::PoolAllocator::oomHandling(unsigned long, unsigned long, unsigned long, bool)+0xf0 at PoolAllocator.cpp:1280 (libhdbbasis.so)
3: 0x00007fff75ef36e8 in MemoryManager::PoolAllocator::allocateNoThrowImpl(unsigned long, void const*)+0x248 at PoolAllocator.cpp:2507 (libhdbbasis.so)
4: 0x00007fff776f743c in ltt::allocator::allocate(unsigned long)+0x5c at memory.cpp:146 (libhdbdataaccess.so)
5: 0x00007fff7728faa8 in DataAccess::BackupChannel::BackupChannel(ltt::allocator&, ResourceManager::ResourceContainer&, DAEncryption::EncryptionManager const*, DataAccess::PersistenceManager&, ltt::smartptr_handle<Stream::ChannelCallback> const&, unsigned long, PageAccess::PageIO*, PageAccess::PhysPageNo const&, DAEncryption::InitializationVector const&, DataAccess::PersistentSpaceRestartData const&, PageAccess::Converter*, PageAccess::Converter*, PageAccess::Converter*, PageAccess::Converter*, unsigned long const&, unsigned long const&, bool, bool, unsigned long&)+0x15b8 at releasable_handle.hpp:449 (libhdbdataaccess.so)
6: 0x00007fff7736a918 in DataAccess::PersistentSpaceImpl::openBackupChannel(ltt::allocator&, PageAccess::PhysPageNo const&, DAEncryption::InitializationVector const&, DataAccess::PersistentSpaceRestartData const&, ltt::smartptr_handle<Stream::ChannelCallback>, unsigned long, unsigned long const&, unsigned long const&, bool, bool, unsigned long&)+0x108 at PersistentSpaceImpl.cpp:2653 (libhdbdataaccess.so)
7: 0x00007fff772d39f4 in DataAccess::PersistenceManagerImpl::BackupHandlerImpl::triggerBackup(ltt::smartptr_handle<Stream::ChannelCallback> const&, unsigned long, unsigned long&)+0x184 at releasable_handle.hpp:463 (libhdbdataaccess.so)
8: 0x00007fff772d3e90 in DataAccess::DataBackupHandler::triggerBackup(ltt::smartptr_handle<Stream::ChannelCallback> const&, unsigned long, unsigned long&)+0x20 at BackupInfoRestartData.hpp:43 (libhdbdataaccess.so)
9: 0x00007fff8adfcd58 in Backup::BackupSrc_CommonSnapshot::prepareBackupOperation()+0x1f8 at TraceEntryExit.hpp:103 (libhdbbackup.so)
10: 0x00007fff8ad79a34 in Backup::BackupExe_SimpleExecutor::globalSavepoint(ltt::list<ltt::smartptr_handle<Backup::BackupSrc_Source> >&, unsigned long&, unsigned long&, ltt::guid&, unsigned long&)+0x154 at BackupExe_SimpleExecutor.cpp:261 (libhdbbackup.so)
11: 0x00007fff8ad2c9f4 in Backup::BackupExe_RequestHandler::globalSavePoint(Backup::BackupExe_Request&, Backup::BackupExe_Response&)+0x254 at BackupExe_RequestHandler.cpp:534 (libhdbbackup.so)
12: 0x00007fff8ad2d58c in Backup::BackupExe_RequestHandler::handleRequest(Backup::BackupExe_Request&, Backup::BackupExe_Response&, Backup::BackupCbc_Federation*, Backup::RecoverCbc_Federation*)+0x1ec at BackupExe_RequestHandler.cpp:420 (libhdbbackup.so)
13: 0x00007fff8adb3b40 in Backup::Backup_ExecutorHandler::handleRequest(TrexNet::Request&, Backup::BackupCbc_Federation*)+0xe0 at Backup_RecoverHandler.cpp:191 (libhdbbackup.so)
◉ This means the first 4 Callstacks coming from the allocation, means from the oom, itself
◉ The following once are showing us that a backup was executed
◉ Global savepoint was executed and a snapshot (yes, a HANA backup based on a kind of snapshot) was created
◉ This crashed the server because no more memory was available at this point in time
◉ Next step: we have to check all other allocators and the complete sizing of the server
For details we can check the system for IPMM short info and search for the allocators, or we are using the dump analyzer for visualization.
IPMM short info:
GLOBAL_ALLOCATION_LIMIT (GAL) = 189.39gb (203360829440b), SHARED_MEMORY = 15.79gb (16958947328b), CODE_SIZE = 1.99gb (2140995584b), OOM_RESERVATION_ALLOCATOR_SIZE = 96.18mb (100859904b)
PID=57454 (hdbcompileserver), PAL=119.47gb (128290521088b), AB=1.27gb (1367474176b), UA=0, U=192.34mb (201686714b), FSL=0b, FMC=0b, Blocked=979.75mb (1027342336b)
PID=57456 (hdbpreprocessor), PAL=119.47gb (128290521088b), AB=1.25gb (1346764800b), UA=0, U=171.11mb (179424071b), FSL=0b, FMC=0b
PID=65384 (hdbindexserver), PAL=119.47gb (128290521088b), AB=119.47gb (128290521088b), UA=0, U=99.17gb (106492272674b), FSL=0b, FMC=0b
PID=57820 (hdbwebdispatcher), PAL=119.47gb (128290521088b), AB=1.47gb (1581187072b), UA=0, U=392.86mb (411946659b), FSL=0b, FMC=0b
PID=28599 (hdbnameserver), PAL=119.47gb (128290521088b), AB=11.15gb (11974541312b), UA=0, U=3.51gb (3774016214b), FSL=160mb (167772160b), FMC=4gb (4306436096b)
Total allocated memory= 152.41gb (163660431360b)
Total used memory = 121.21gb (130159289244b)
Sum AB = 144560488448
Sum Used = 111059346332
Heap memory fragmentation: 20% (this value may be high if defragmentation does not help solving the current memory request)
Top "M_HEAP_MEMORY" allocators (component, name, size). Ordered descending by inclusive_size_in_use.
1: System: / 99.17gb (106492272674b)
2: System: Pool 94.36gb (101319674758b)
3: Monitoring & Statistical Data: Pool/Statistics 25.22gb (27083137056b)
4: System: Pool/RowEngine 24.74gb (26567735344b)
5: System: Pool/PersistenceManager 20.33gb (21839976360b)
6: System: Pool/RowEngine/QueryExecution 11.04gb (11858086600b)
7: System: Pool/RowEngine/QueryExecution/SearchAlloc 10.97gb (11788559016b)
8: System: Pool/ResourceContainer 8.75gb (9406436776b)
9: System: Pool/PersistenceManager/ContainerFileIDMapping 8.02gb (8614085728b)
10: System: Pool/PersistenceManager/VirtualFile entry TID map 6.76gb (7268271488b)
11: Row Store Tables: Pool/RowStoreTables 6.17gb (6628813168b)
12: Row Store Tables: Pool/RowStoreTables/CpbTree 6.07gb (6525295232b)
13: System: Pool/RowEngine/Session 4.92gb (5291610176b)
14: System: AllocateOnlyAllocator-unlimited 4.36gb (4689452952b)
15: Caches: Pool/RowEngine/SQLPlan 4.13gb (4445782520b)
16: System: AllocateOnlyAllocator-unlimited/FLA-UL<24592,1>/MemoryMapLevel3Nodes 3.99gb (4288820208b)
17: System: AllocateOnlyAllocator-unlimited/FLA-UL<24592,1> 3.99gb (4288820208b)
18: System: Pool/PersistenceManager/PersistentSpace 3.63gb (3905547760b)
19: System: Pool/ResourceContainer/ResourceHeader 3.47gb (3734215968b)
20: Statement Execution & Intermediate Results: Pool/Contexts 3.22gb (3463665264b)
Result of the analyses => have a look at the dump analyzer
HANA Dump analyzer (java)
You can find a current version of the SAP HANA dump analyzer here.
Usage:
◉ Update your JDK (at least JDK 8.0 is required)
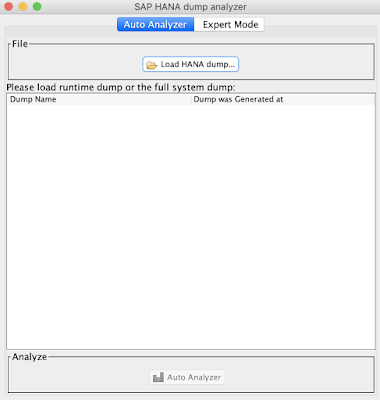
◉ Double click on HANADumpAnalyzer.jar
◉ Self-explainable GUI
◉ You can see that the hdbindexserver PAL (=Process Allocation Limit) is at 119,47GB
◉ The AB (Allocated Bytes) is also at 119,47GB
◉ So there is a bottleneck at the PAL or one of its heap allocators
Term clarification:
| SId | Process secondary identifier |
| AB | Allocated bytes by allocators for heap and stacks (inclusive allocator cache) |
| UA | Unaccounted memory (by unlimited allocators for exceptions etc.), maybe overcommit |
| U | Used bytes for heap and stacks (without allocator cache) |
| FSL | Free segment list size |
| FMC | Free precharge memory cache size |
| SMAS/SMDS | System memory traffic information (accumulation of allocations/deallocations) |
| PAL | Process allocation limit |
| TPAL | Temp process allocation limit |
| Blocked | Memory (TPAL!) blocked/reserved for this process |
| W | Weight of process |
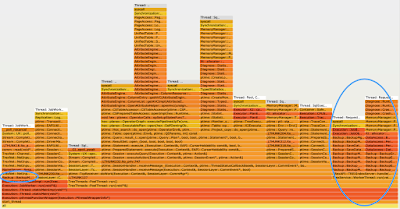
Heap Allocators with the OOM Flame Graph (Expert Mode):
Memory Allocator FlameGraph
The following Memory FlameGraph shows the memory consumption distribution from HANA allocators. The wider box consumes more memory. Move the cursor onto the box to display the memory consumed by the allocator. Check for SAP Note 1999997 for allocator-specific recommendations
If you don’t know FlameGraph check out the usage at the website of Brendan Gregg.
You can search for terms in the right upper corner and you can zoom in with a left click and reset zoom with a right click.
◉ You may have noticed that the pool allocator with nearly 100% has only 96GB
◉ Our PAL is at 119GB
◉ There is heap fragmentation which is explained at the IPMM report on the last line:
◉ “Heap memory fragmentation: 20% (this value may be high if defragmentation does not help solving the current memory request)”
◉ Our Backup request reached the limit with only 1,6GB more memory allocation
◉ This the reason for the oom as result of to less memory left but not the root cause
◉ Also all other allocators are not as big as we could identify a bottleneck
◉ Solution: extend the PAL because we have some memory left till we hit the GAL
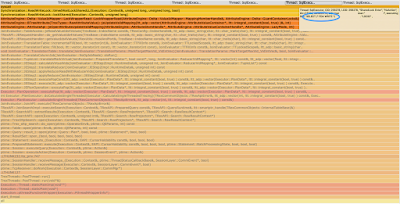
Here we can see the mixed Flame Graph (expert mode: concurrency) for a detailed thread analyses which is not needed in this case.
Index Server Crash example
Auto Crash Analysis with HANA Dump Analyzer
◉ Check the first stack call (0) for known issues in SMP
◉ If your issue is not under the search results use call stack 1 or 2 to expand the search
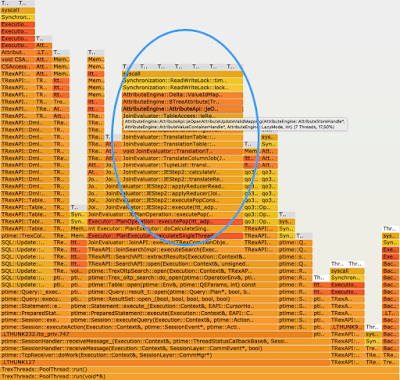
Mixed Flame Graph
◉ Use the search in the upper right corner and search for the term which we have seen in our stacktrace (see above): AttributeEngine::BTreeAttribute<TrexTypes::RawAttributeValue>::jeUpdateValidMapping
◉ 7 threads are using this call stack
◉ There is a very inaccurate note for this issue
◉ “Due to a programming error in SAP HANA, indexserver may crash caused by a rare race condition between reading and writing the dictionary of a column store table.”
The manual way
Have a look at the following areas to get a quick overview:
CRASH_SHORTINFO
CRASH_EXTINFO
CRASH_CONTEXT
CRASH_STACK
[CRASH_STACK] Stacktrace of crash: (2019-11-12 22:26:57 779 Local)
----> Symbolic stack backtrace <----
0: AttributeEngine::BTreeAttribute<TrexTypes::RawAttributeValue>::jeUpdateValidMapping(ltt_adp::vector<AttributeEngine::AttributeValueContainer*, ltt::integral_constant<bool, true> >&, int) + 0x528
Symbol: _ZN15AttributeEngine14BTreeAttributeIN9TrexTypes17RawAttributeValueEE20jeUpdateValidMappingERN7ltt_adp6vectorIPNS_23AttributeValueContainerEN3ltt17integral_constantIbLb1EEEEEi
SFrame: IP: 0x00007fff9df357e8 (0x00007fff9df352c0+0x528) FP: 0x00007ffeec2316b0 SP: 0x00007ffeec2214f0 RP: 0x00007fff9c532bf4
Params: 0x1ffb2df200000, 0x2f30a, 0x0, 0x7fff9995386c, 0x2b0000002b, 0x0, 0x1ec2a5313e160021, 0x1ec2a5313e1600
Regs: gpr00=0x7fff9df35734, gpr02/toc=0x7fffa031bc00, gpr03/arg1/ret=0x1ffb2df200000, gpr04/arg2=0x2f30a, gpr05/arg3=0x0, gpr06/arg4=0x7fff9995386c, gpr07/arg5=0x2b0000002b, gpr08/arg6=0x0, gpr09/arg7=0x1ec2a5313e160021, gpr10/arg9=0x1ec2a5313e1600
Source: AttributeStatistics.hpp:32
Module: /usr/sap/SID/HDB00/exe/libhdbcs.so
-----------------------------------------
1: AttributeEngine::AttributeApi::jeOpenAttributeUpdateValidMapping(AttributeEngine::AttributeStoreHandle*, AttributeEngine::AttributeValueContainerHandle*, AttributeEngine::LazyMode, int) + 0x444
Symbol: _ZN15AttributeEngine12AttributeApi33jeOpenAttributeUpdateValidMappingEPNS_20AttributeStoreHandleEPNS_29AttributeValueContainerHandleENS_8LazyModeEi
SFrame: IP: 0x00007fff9c532bf4 (0x00007fff9c5327b0+0x444) FP: 0x00007ffeec2319c0 SP: 0x00007ffeec2316b0 RP: 0x00007fff9c533144
Source: AttributeApi.h:151
Module: /usr/sap/SID/HDB00/exe/libhdbcs.so
-----------------------------------------
2: AttributeEngine::AttributeApi::jeReadIndex(TRexUtils::IndexVectorAligned const&, TRexUtils::BitVector const*, ltt::vector<int> const*, bool, long, TRexUtils::IndexVectorAligned&, TRexUtils::IndexVectorAligned&, AttributeEngine::QueryStats&) + 0xb4
Symbol: _ZN15AttributeEngine12AttributeApi11jeReadIndexERKN9TRexUtils18IndexVectorAlignedEPKNS1_9BitVectorEPKN3ltt6vectorIiEEblRS2_SD_RNS_10QueryStatsE
SFrame: IP: 0x00007fff9c533144 (0x00007fff9c533090+0xb4) FP: 0x00007ffeec231af0 SP: 0x00007ffeec2319c0 RP: 0x00007fff8b82aec8
Source: AttributeApi.h:187
Module: /usr/sap/SID/HDB00/exe/libhdbcs.so






No comments:
Post a Comment